|
|
|
|
Do-It! Help: Graphs
|
| |
Viewing Graphs
|
| |
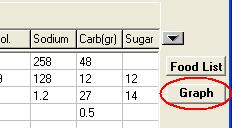
To view Graphs, click the Graph button on the Daily Log:
The Graph window will appear showing the last Graph that you selected.
To change the graph that is displayed, click the Display button on the Graph
window: 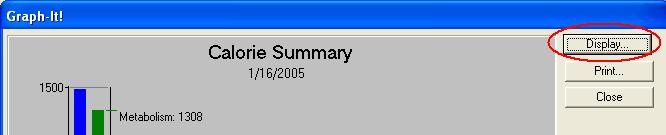
|
| Two Types of Graphs |
| |
The Display Settings window is shown below: 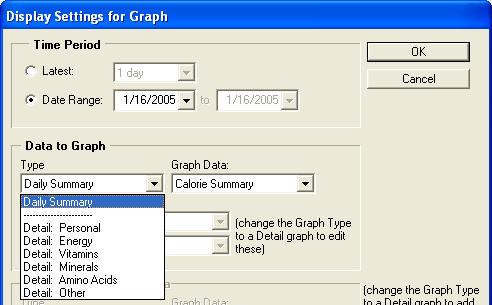
The two types of Graphs that you can display are:
| Daily Summary: |
There are two prebuilt daily summary graphs for you to select: Calorie Summary
and Vitamins / Minerals. Each of this will show you summary data for a single
day at a time.
You can navigate between days using the Day left and Day right buttons on the
main graph window.
|
| Detail Graph: |
If you would like to plot a value such as your calories or weight over time,
use the Detail Graph.
You can then choose between different Types and Graph Data to find the values
you are interested in.
You can also display a second set of data on your graph by checking: Graph
Secondary Data.
Note:Use the settings in the Time Period area to select the date range
to be graphed.
|
|
| |
|
|